
Insights Report Builder
From fragmented intelligence locked inside dashboards to executive-ready reports delivered automatically - without requiring a single login.
Senior stakeholders at CropIn’s enterprise clients struggled to access meaningful agricultural intelligence — not because the data didn’t exist, but because it was fragmented across multiple modules requiring active navigation. I led the design of the Insights Report Builder: a no-code configuration system that enables admins to compose modular executive reports spanning crop health, DEWS (Disease Early Warning System), operational progress, alerts, yield forecasting, and harvest insights into a single, contextual view of seasonal performance.
Designed for executive visibility, the system transformed fragmented product intelligence into stage-aware, reusable reports, helping leadership teams monitor agricultural programs without navigating complex workflows. Configured reports could then be integrated into Farm Engagement workflows for automated delivery via Email, WhatsApp, or SMS — extending insights beyond dashboards and into day-to-day decision-making.
Time Period
2 Months, 2025
Role
Lead Product Designer (Individual Contributor)
Team
1 Product Manager, 2 Backend Engineer, 1 Frontend Engineer, 1 Data Scientist, 2 QA
Responsibilities
Project Lead
Product & Design Strategy
Widget Repository Architecture
UX Research & Insight Synthesis
Stakeholder Management
Interaction Design & System Flows
Cross-platform Design
Prototyping & User Testing
Outcome
Launched as a beta feature across 3 pilot clients, achieving a 91% executive report open rate (target ≥85%). Reduced manual reporting effort for project managers by ~7 hours per week. The reusable widget repository reduced new insight module implementation time from 10–15 days to 2–3 days, improving reporting scalability. Adoption reached 68% by month 4.

Fragmented Visibility for the People Who Matter Most
Problem Space
Cropin Cloud surfaced powerful agricultural intelligence — NDVI crop health, DEWS disease predictions, weather advisories, task compliance, and harvest estimations. But this intelligence lived across operational modules, requiring active navigation and interpretation.
For executives responsible for regional performance and seasonal outcomes, visibility wasn’t missing. It was fragmented
“I don’t have time to click through five modules. I need one view, once a week, that tells me if the season is on track.”
Executive Director, Seed Company - Research Interview
“I don’t need another login. I need the insights to come to me.”
CXO, Agri-input Company - Research Interview
We conducted 12 executive interviews across agri-input organizations, seed companies, procurement teams, and food conglomerates to understand:
how leadership consumes agricultural intelligence
what decisions matter most during a season
and why existing dashboards weren’t being used
The signal was consistent:
Executives didn’t want more dashboards. They wanted clearer visibility.
Executive Behaviour
Research Signal
Design Implication
Leadership reviews platform data less than once per week
90%
Pull-based dashboard UX fails this audience
Seasonal intelligence is perceived as fragmented across modules
85%
Create a unified executive reporting layer
Leaders prefer summaries via Email or WhatsApp over logging in
92%
Meet users in their existing communication workflow
AI predictions exist, but lack decision context
78%
Surface DEWS + yield intelligence in executive-ready narratives
The Diagnosis
CropIn didn’t have a data problem. It had a visibility problem.
The platform already generated rich agricultural intelligence. But there was no mechanism to transform fragmented operational signals into a single, contextual narrative for leadership.
The missing layer wasn’t analytics.
It was orchestration — a way to synthesize, curate, and proactively deliver stage-aware intelligence to the people making seasonal decisions.
Problem Statement
CropIn’s agricultural intelligence ecosystem was rich but fragmented, creating friction between insight availability and executive decision-making. Critical intelligence - crop health, DEWS predictions, weather advisories, yield estimations, and operational progress -existed across multiple modules, making it difficult for senior stakeholders to access a reliable, contextual view of seasonal performance without active navigation.
Opportunity statement
Design an executive-ready reporting system that transforms fragmented agricultural intelligence into accessible, contextual, and actionable reports, enabling leadership teams to monitor seasonal progress without logging into complex operational workflows - while balancing flexibility, scalability, and trust in AI-driven insights.
Design challenge
How might we design a configurable executive reporting system that synthesizes fragmented agricultural intelligence into stage-aware, trustworthy insights - delivered in the right format, at the right time, without requiring leaders to actively navigate the platform?
Five Principles Derived Directly from Research
Design Principles
Before designing a single screen, we translated executive research into a set of principles that would guide every design decision — from information architecture and report composition to delivery logic and trust-building.
Push > Pull
Executives don’t log in regularly. The system must deliver intelligence proactively - not expect leaders to navigate dashboards in search of answers. Insights should come to them, not the other way around.
Signal > Noise
Dashboards expose everything. Reports must surface what matters most. A report is not a compressed dashboard — it is a curated signal, designed to reduce cognitive load and accelerate decision-making.
Stage - Aware
Agriculture is seasonal. A germination report is irrelevant during harvest, and harvest intelligence is meaningless during onboarding. Reports must adapt to where the crop lifecycle actually is. Context transforms data into intelligence.
Configurable
No two enterprise clients define success the same way. Different organizations track different KPIs, risks, and seasonal priorities. The system must support modular configuration without sacrificing usability.
Trust through Transparency
Executives trust decisions only when they trust the data behind them. Reports should clearly communicate:
data freshness
source confidence
timestamps
AI prediction context
When information is incomplete or delayed: the system should say so explicitly.
A Two-Layer System for Automated Reports Delivery
Solution Overview
The solution wasn’t a standalone reporting feature. It was an orchestration layer designed to move fragmented agricultural intelligence from CropIn’s operational systems into executive-ready visibility.
To reduce complexity while maintaining flexibility, the experience was intentionally separated into two tightly connected layers:
1. Compose
2. Deliver (not part of this case study)
Authoring
Insights Report Builder
A no-code configuration system for creating reusable executive reports.
→ Select insight modules (health, DEWS, alerts, yield, operational progress)
→ Define reporting context (project, crop stage, date range, DAS window)
→ Configure cadence (weekly, monthly, milestone-based)
→ Preview report output in real time
→ Save as reusable reporting configuration
Delivery (not part of this case study)
Farm Engagement - Communication Configuration
A communication orchestration layer that transforms reports into automated stakeholder updates.
→ Attach saved reports to communication workflows
→ Select delivery channels (Email, WhatsApp, SMS)
→ Define audience groups (CXOs, regional heads, program managers)
→ Configure trigger logic (schedule, crop stage, threshold event)
→ Enable fallback delivery if the primary channel fails
Insights Builder creates the intelligence artifact. Farm Engagement creates the delivery relationship. Together, they enable proactive executive visibility.
The Delivery Workflow
A report is not valuable when configured. It becomes valuable when delivered consistently, contextually, and without manual effort.
Configure in Insights Builder
Admins define the report structure by selecting:
projects
crop stage
reporting window
insight modules
cadence
Live preview ensures confidence before saving the report as a reusable configuration.
Connect to Communication Workflow
Inside Farm Engagement, admins attach the saved report to a communication workflow, turning a static configuration into an automated reporting system.
Configure Delivery Logic
Admins define:
communication channels (Email, WhatsApp, SMS)
stakeholder groups
delivery cadence
milestone or event-based triggers
Fallback logic ensures continuity if a preferred channel fails.
Intelligence is Generated & Delivered
At the configured trigger point, the system automatically generates a contextual report using the latest seasonal intelligence, applies client branding, and delivers it through the selected communication channels. No manual reporting required.
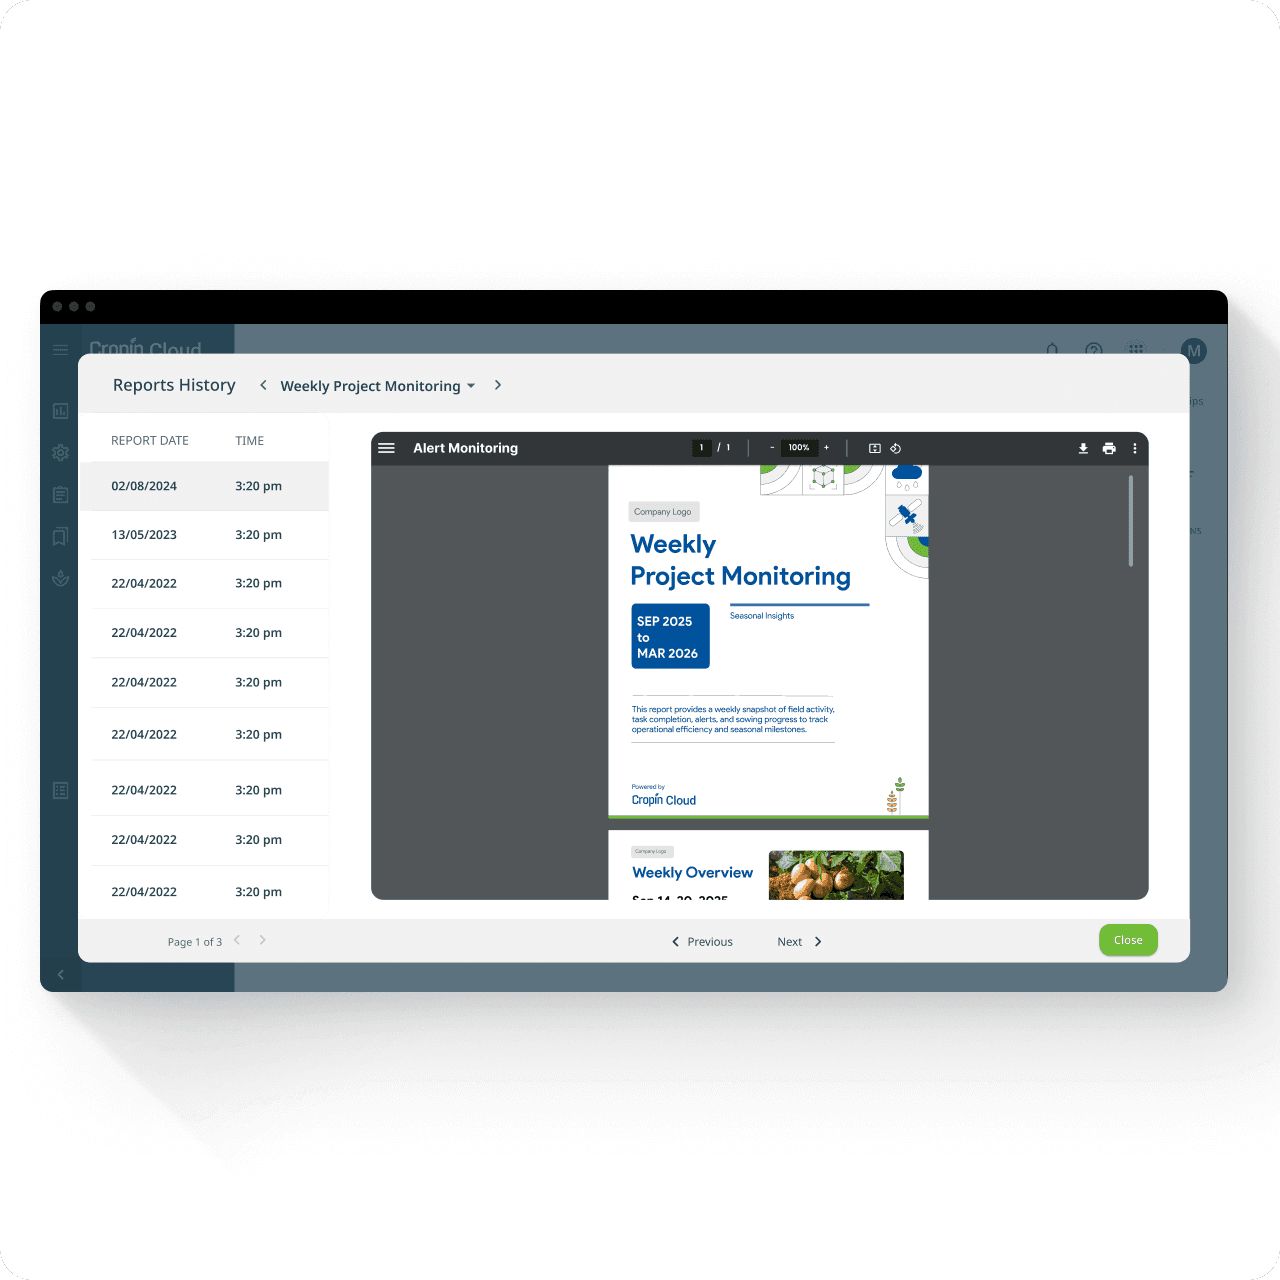
Reports History Creates Accountability
Every generated report is archived with:
timestamp
delivery status
report preview
delivery channel
Creating a transparent audit trail for teams to verify what was sent, when, and to whom.
Design Walkthough
Every Decision Explained
The experience was intentionally reduced to four core screens, each optimized for a distinct mental model.
Rather than compressing everything into a single configuration flow, the system separates scope definition, report composition, delivery verification, and operational oversight - reducing cognitive overload while increasing confidence.
The same RAG intelligence powers both, but the interface adapts to the user’s environment and emotional need.
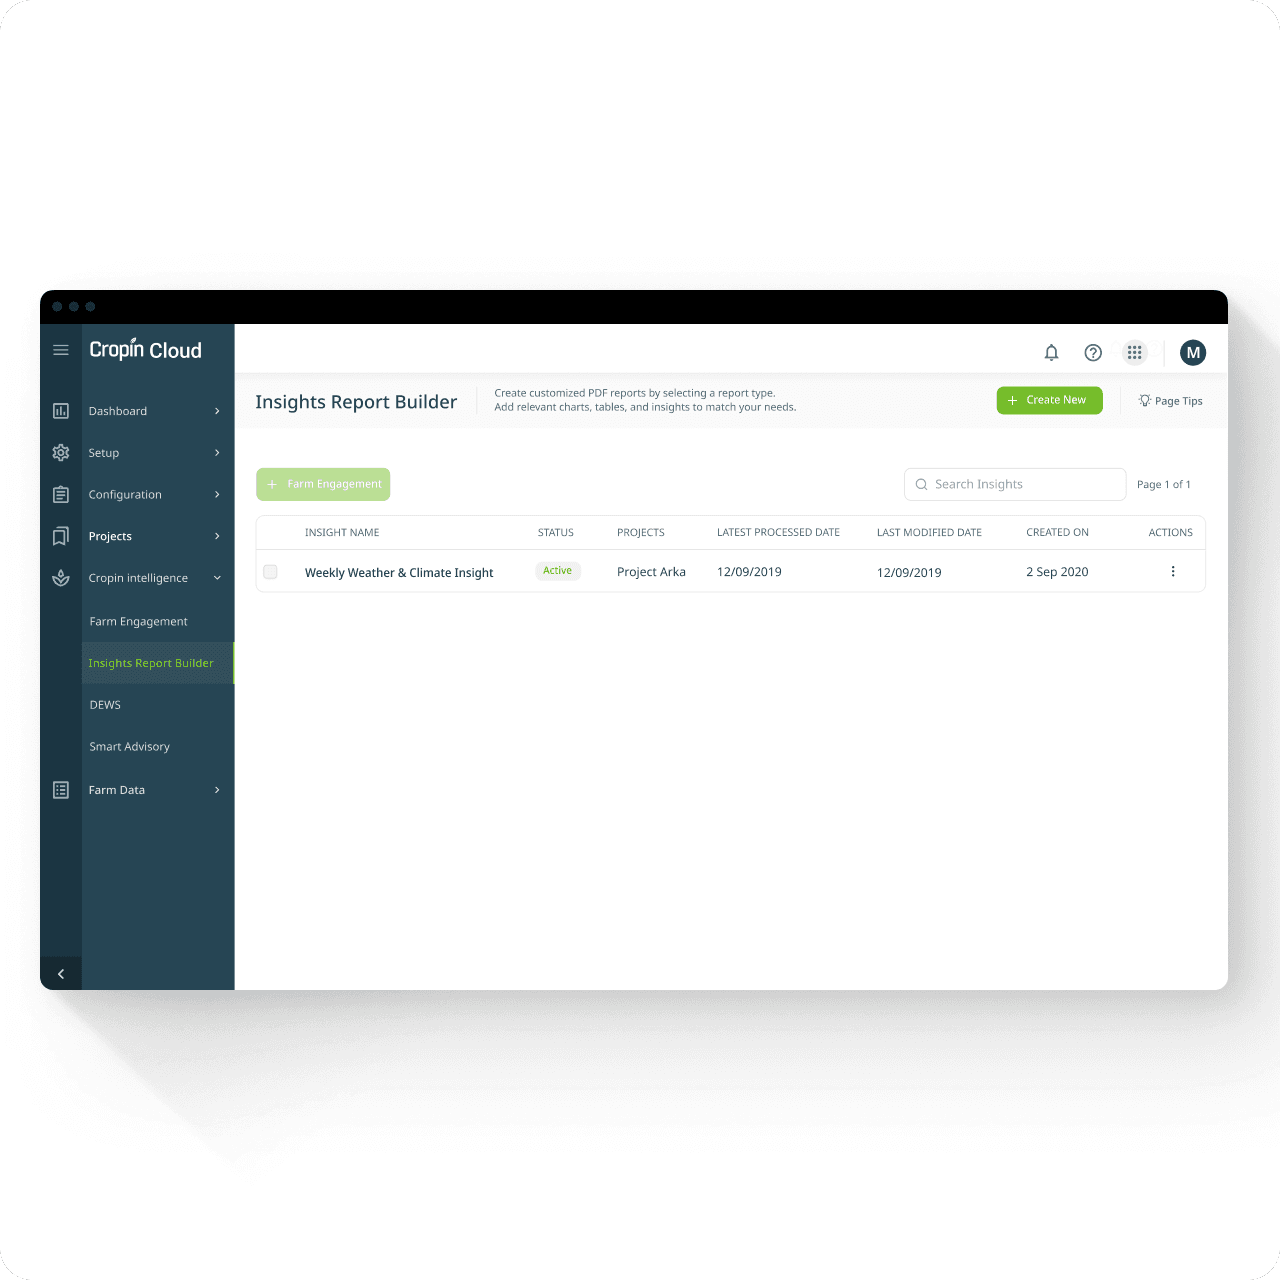
The Control Center - Landing Page
A centralized registry of all configured reports — designed for visibility, governance, and operational scale. Admins needed more than a creation entry point. They needed a place to manage report health, verify execution, and understand system state at a glance.
Insights Report Builder - Landing

Why these decisions mattered
Farm Engagement remains visible
Reports were never standalone outputs. Keeping Farm Engagement visible reinforced the downstream reality: Every report eventually becomes a communication workflow. This reduced module-switching and preserved context.
Status is visible before entry
Three dates answer three different questions
Search built for future scale
Insight Report Creation Form - Which Data Universe?
Before deciding what intelligence to include, admins first define where that intelligence should come from. This screen answers a foundational question:
“What exactly is this report about?”
Project, crop, season window, growth stage, DAS range, timezone, and cadence collectively define the report’s data universe.
Insight Report Creation Form - Step 1 of 2
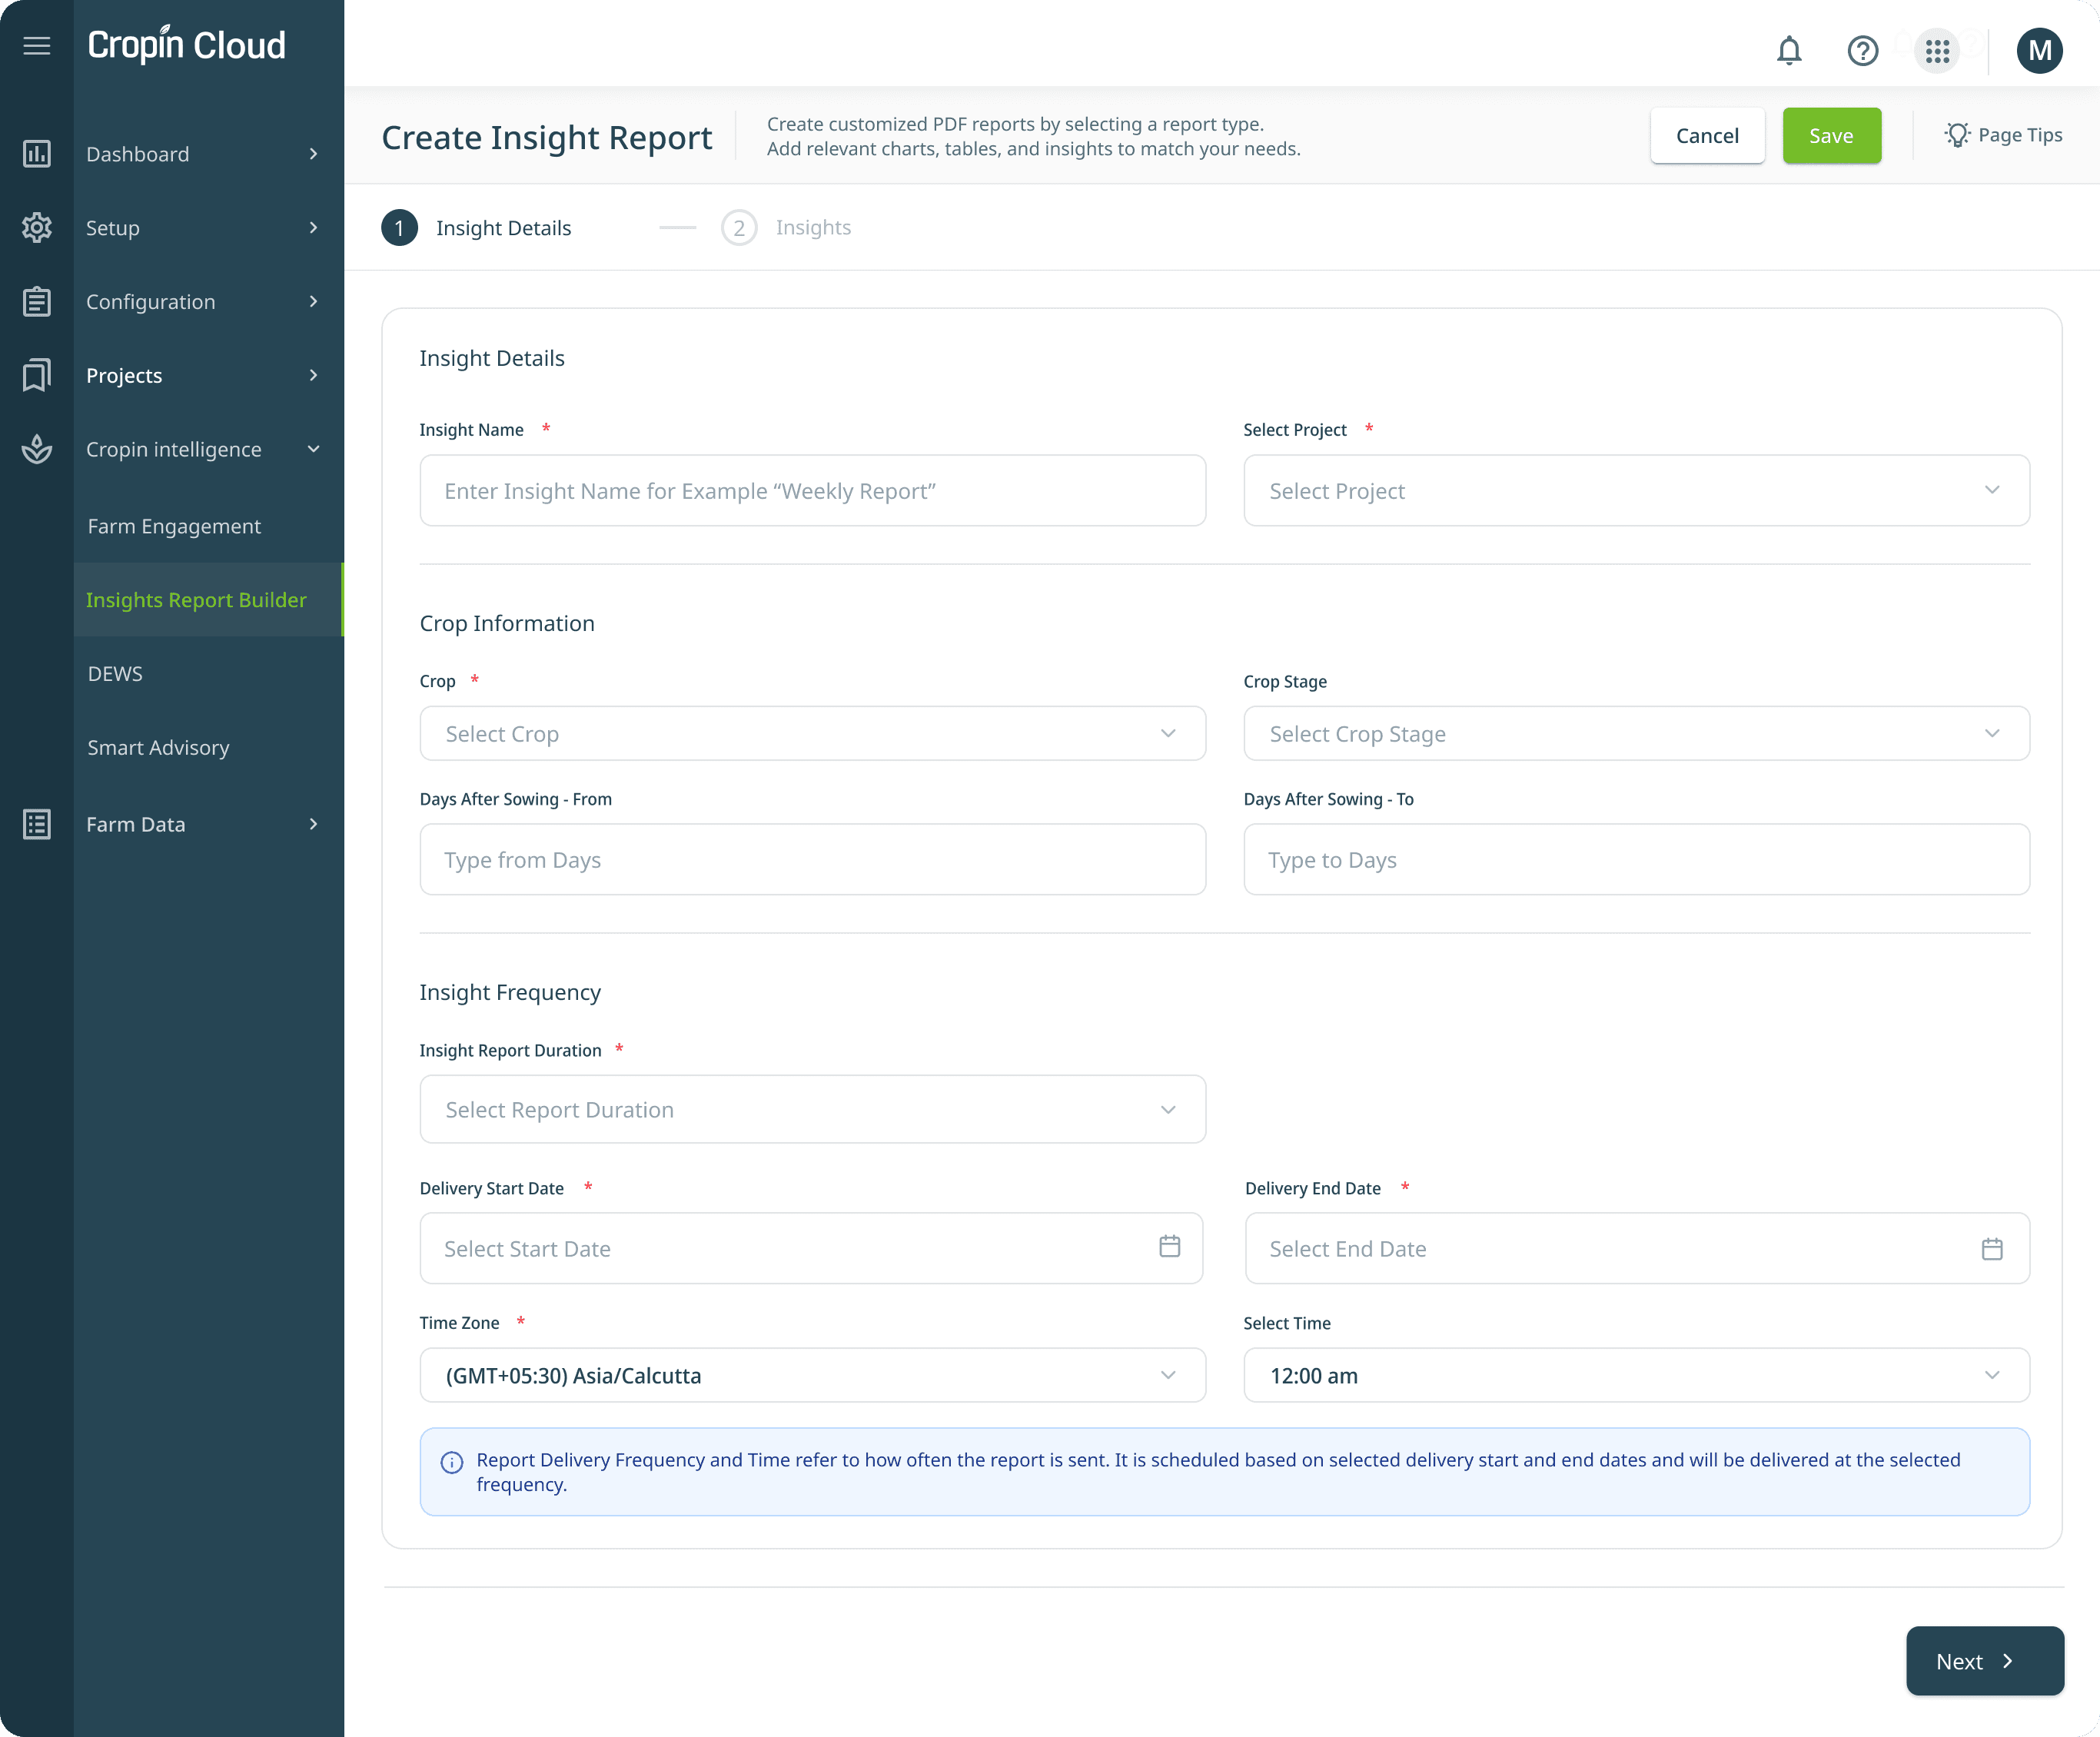
Design rationale behind each field
Field
Why it exists
Insight Name
Creates discoverability across communication workflows, delivery logs, and report history. Naming becomes operational metadata.
Project
Prevents cross-project contamination and ensures enterprise data isolation.
Date Range
Anchors the report to a meaningful season window while reducing configuration errors through calendar-based validation.
Crop + Growth Stage
Makes domain intelligence contextual. Disease predictions and health indicators only matter when interpreted against crop lifecycle.
Days After Sowing (DAS)
Introduces precision for time-sensitive intelligence such as disease prediction and intervention readiness.
Frequency
Derived directly from research: weekly for operational visibility, monthly for strategic oversight, milestone-based for seasonal transitions.
Timezone + Time
Critical for global deployments - reports should arrive at the start of an executive’s day, not system midnight.
Key Design Decisions
Why the flow was split into two steps? We intentionally separated:
Step 1 → Define the data universe
Step 2 → Compose the intelligence narrative
These are fundamentally different mental models.
Combining both created cognitive overload:
“What data should I pull?”
vs
“How should I tell the story?”
Breaking the flow improved clarity and reduced configuration error.
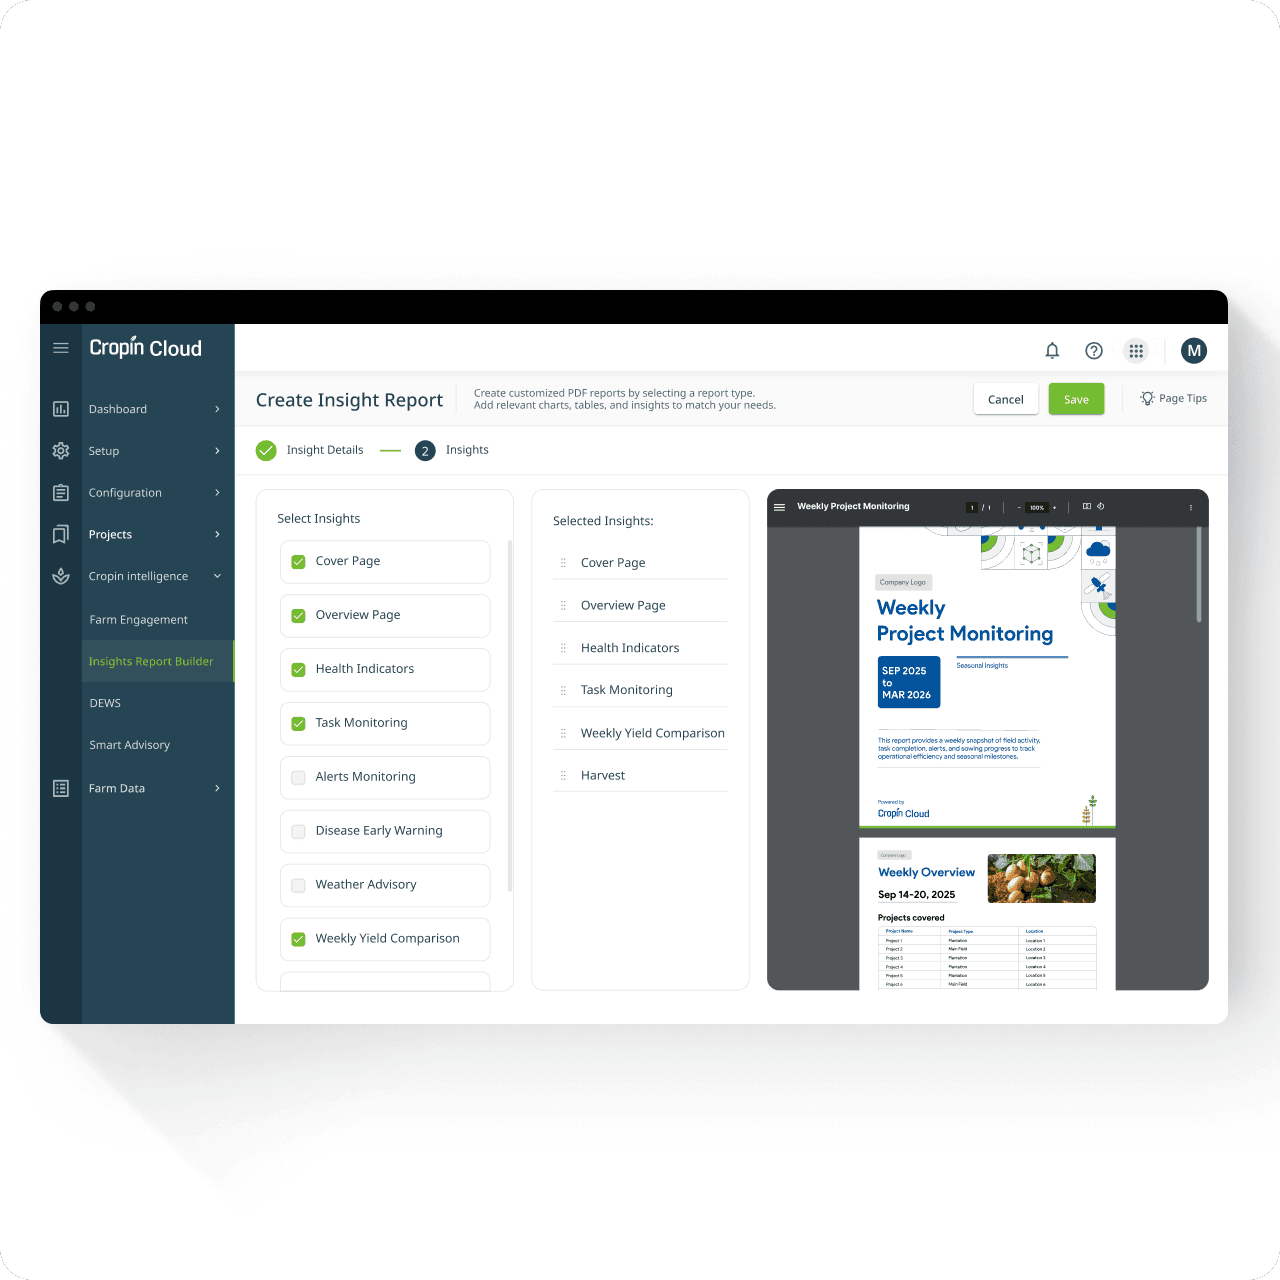
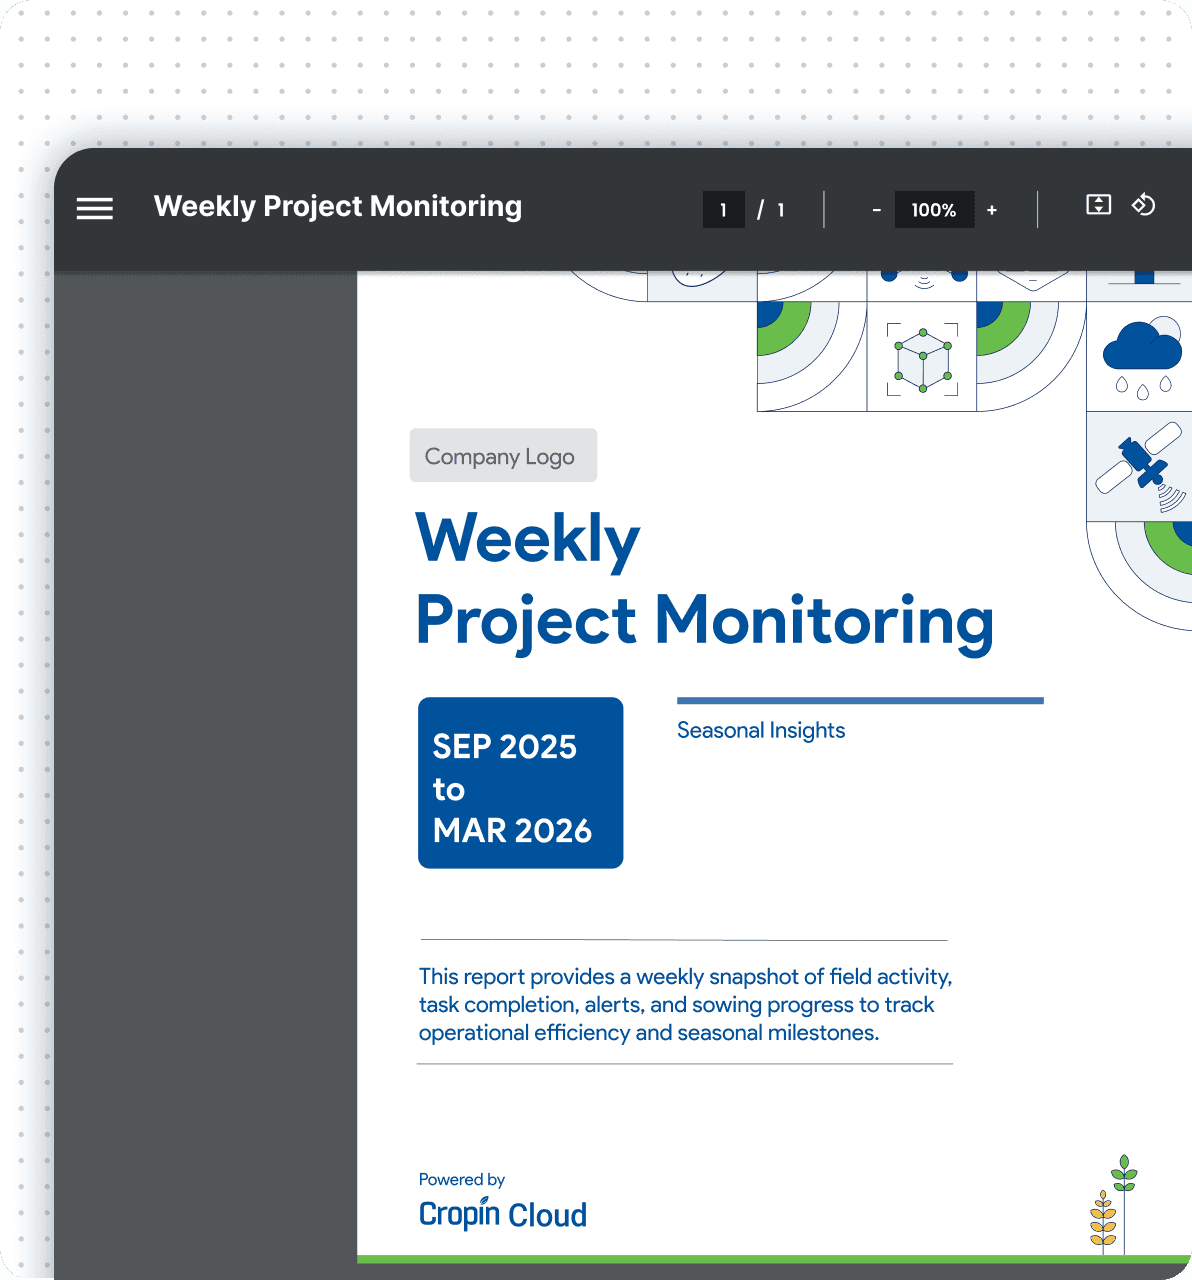
Insight Composition - Which Data Modules?
Once scope is defined, admins move from data selection to narrative construction.
This screen determines: What should an executive actually see?
Rather than forcing rigid templates, the system supports modular intelligence composition. Admins choose relevant modules, control order, and validate output in real time.
Insight Report Creation Form - Step 2 of 2

Why these decisions mattered
Live preview removes uncertainty
The preview renders the actual PDF output, not a placeholder approximation. Admins see: branding, hierarchy, layout, narrative structure before saving. This resolved a recurring pilot concern: “I didn’t realize the report would look like this.”
Drag-to-reorder introduces narrative control
Non-destructive composition encourages exploration
Available Modules - Phase 1
Module
What it Shows
Why Leaders Care
Cover Page
Branding, title, reporting period
Professional context and stakeholder confidence
Summary / Overview Page
Key seasonal metrics
30-second executive understanding
Health Indicators
NDVI and crop health trends
Early risk detection without field visits
Task Monitoring
Field execution vs schedule
Operational accountability
Alerts Monitoring
Disease / pest alerts + severity
Intervention prioritization
Disease Early Warning
AI-based risk prediction
Action before visible symptoms
Weather Advisory
Climate anomalies and warnings
Operational preparedness
Weekly Yield Comparison
Estimated vs actual yield
ROI and harvest readiness
Pre / Harvest / Post-Harvest
Stage-specific KPIs
Seasonal performance tracking
Outcomes
Goals met, measured and validated
Measured Impact:
3 Pilot Clients, 8 Weeks
We measured success against the product’s original goals - executive visibility, delivery reliability, adoption, and PM reporting effort reduced - alongside qualitative feedback from pilot users.
Metric
Success Criteria
Pilot Result
Executive report open rate
≥85%
91% (email)
Report data accuracy
≥90%
94% validated against backend systems
Delivery failure rate
≤3%
1.8% with retry + fallback routing
Client adoption
≥75% in 6 months
68% adoption by month 4 (on track)
User satisfaction
≥4/5
4.6/5 (n=24)
PM (Project Manager) time saved
-
~7 hrs/week reduction in manual reporting
What changed in practice
“I don’t log into CropIn anymore. The report comes to me every Monday. I see red alerts, I call my regional head. That’s the flow I need.”
Executive Director, Agri-Input Enterprise · Pilot Client
“Before, I spent half a day every Monday pulling information from multiple modules. Now I review the report, add context, and send it upward. It changed the rhythm of my week.”
Project Manager · Pilot Client
From Configuration to Executive Action - Closing the Last Mile
CropIn already had the intelligence. The missing piece was delivery. Insights Builder creates the intelligence artifact. Farm Engagement operationalises distribution - moving curated, stage-aware insights from dashboards to the people making seasonal decisions.
Together, they close the final gap between:
data availability → decision visibility
Before - Intelligence Stayed Inside the Platform
Weekly reporting depended on manual effort across multiple module.
Executives received generic PDFs with inconsistent timing
DEWS, health signals, and yield intelligence rarely reached decision-makers
Delivery success was invisible — failures required backend support
~7 hours/week spent compiling reports manually
After - Intelligence Became a System
Reports generate automatically from a reusable configuration
Delivery happens through preferred channels (Email, WhatsApp, SMS)
Executives receive stage-aware, contextual intelligence proactively
Retry logic, fallbacks, and audit logs increase reliability
91% report open rate during pilot rollout~7 hours/week returned to PMs
Every Monday at 9:00 AM IST, a regional leadership team receives a weekly project intelligence report automatically.
The Executive Director receives a detailed PDF via email. Regional managers receive a summarized WhatsApp briefing. If delivery fails, the system retries through fallback channels — while every event is logged for auditability.
No exports. No reminders. No manual follow-ups.
Pilot rollout · Agri-input enterprise client
The shift wasn’t from manual → automated. It was from: dashboard visibility → executive visibility
Learnings & Reflections
What This Project Changed About How I Design
Next Steps
Where the Product Could Go Next
Pilot feedback made one thing clear: once intelligence became reliable, users immediately started asking for more contextual, proactive, and decision-oriented workflows.
Pilot Feedback
Future Direction
“I want to compare two projects side by side.”
Cross-project comparison reports - benchmark season health, yield, alerts, and operational KPIs across regions or programs.
“Can I get a report only when DEWS (disease warning) crosses a threshold?”
Event-triggered intelligence delivery - move beyond scheduled reporting into threshold-based alerts and risk escalation.
“The PDF is too long for WhatsApp.”
Channel-native report formats — WhatsApp-first summaries with key metrics, highlights, and expandable deep links instead of full PDFs.
Empty states build or break trust
Human-in-the-loop annotation layer — allow admins or PMs to contextualize system-generated reports before delivery.
“Can we track who actually opened the report?”
Engagement analytics — open rates, click tracking, recipient behavior, and delivery intelligence for communication effectiveness.